[Updated and revised Oct. 1, 2016 to correct a minor math error in the calculations]
Much of the impetus for “green” buildings comes from an oft-repeated statistic about all the energy consumed in or by buildings: “In 2014, 41% of total U.S. energy consumption was consumed in residential and commercial buildings” [U.S. Energy Information Administration]. This statistic, which hovers around 40% plus or minus one or two percentage points, shows up in USGBC publications, U.S. government publications, and in hundreds of other sources.
Remarkably, it’s not easy to track down exactly what this alleged energy use consists of; that is, how exactly buildings are consuming so much of the total energy harvested or produced in the U.S. The problem is that the typical breakdown of energy usage doesn’t clearly identify the sources of energy and their applications — for example, energy use may be identified as “residential” or “commercial” but these values may not include electric power, which often has its own separate category. But we can’t easily find out where and how the electric power is used.

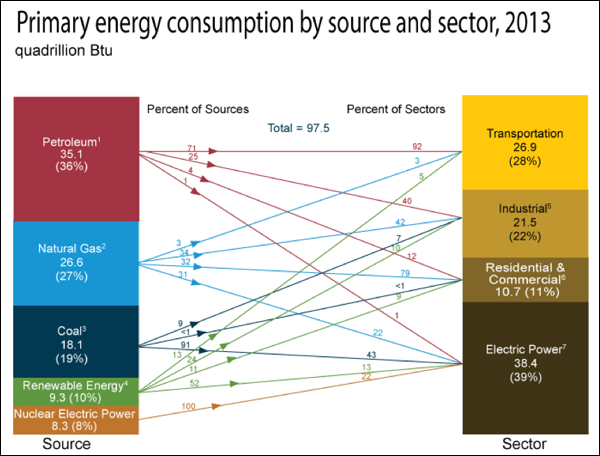
Figure 1. Primary energy consumption by source and sector, 2013 (US). Source: https://www.eia.gov/energy_in_brief/article/major_energy_sources_and_users.cfm
From Figure 1, we see that residential and commercial buildings in the U.S. use 11% of all energy, excluding electric power. Electric power generation uses 39% of all energy, but only some of that is used in residential and commercial buildings.
From Figure 2, we see that EU residential and commercial buildings use approximately 60% of total electricity produced, with residential accounting for about 30% and commercial buildings for the other 30% (it is presumed that the breakdown in similar for U.S. buildings). So that adds another 0.30 x 39% = 11.7% of all energy to residential and 0.30 x 39% = 11.7% to commercial, for a total residential and commercial energy use of 11 + 11.7 + 11.7 = 34.4%.

Figure 2. EU27 Electricity Consumption by Sector. Source: https://shrinkthatfootprint.com/how-do-we-use-electricity
To make these statistics consistent with the oft-cited figure of 40%, we’ll assume that the combined residential and commercial electric usage in the U.S. is 74% of the total, rather than 60%, with 0.37 x 39% = 14.43% of all energy from residential, the same amount from commercial, and a total residential plus commercial energy use of 11 + 14.43 + 14.43 = 40%.
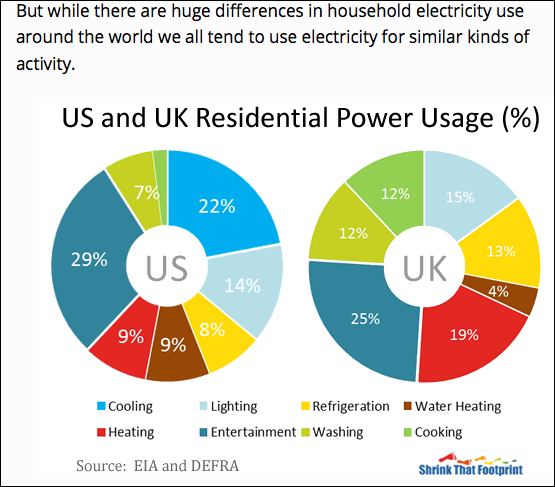
However, not all of this electric energy is used by “the buildings.” From Figure 3, we see that, in the U.S., 44% of this electric use is not really from the “building” itself: 29% of electric use is for entertainment (presumably television, computers, etc.), and another 15% is for things like refrigerators, washing, and cooking. That leaves 56% for the building; so instead of a residential electric usage of 14.43%, the actual “building” usage (cooling, lighting, etc) is more like 0.56 x 14.43 = 8.08% of all energy.

Figure 3. US and UK residential power usage. Source: https://shrinkthatfootprint.com/how-do-we-use-electricity
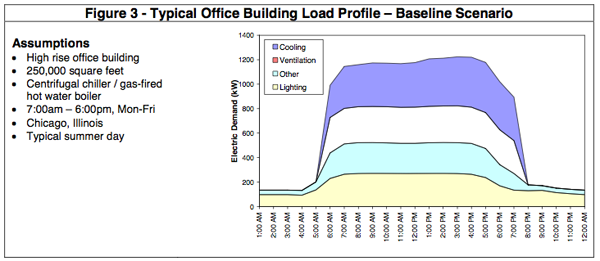
From Figure 4, we can see that commercial (office) buildings use about 20% of their electric usage for “other” things — presumably non-building plug loads — which leaves about 0.80 x 14.43 = 11.54% of all energy consumed in the U.S. for commercial building electric use.

Figure 4. Office building electric load profile. Source: https://www.iluvtrees.org/wp-content/uploads/2009/05/iltofficebuildingprofile.pdf
Adding this all together, we can see that “buildings” (residential and commercial) consume 8.08 + 11.54 = 19.6% of all energy in the form of electricity and another 11% of energy other than electricity (mainly natural gas; see Figure 1). The total energy consumed by residential and commercial buildings is therefore about 30% of all energy consumed in the US, rather than the 40% figure so often cited.
Where does the other 70% go? Well, from Figure 1, we see that 28% goes to transportation (cars, trains, buses, planes, etc.) and 22% goes to industrial applications. The balance (about 20%) goes to various “non-building” uses of electricity (see Figure 2) of which about half, or 10%, is assumed to be for industrial/commercial non-plug-load uses and the remaining 10% is for other “non-building” uses (plug loads) within residential or commercial buildings.
In other words, only by adding the 10% plug load electric energy use to the 30% of total energy actually used by residential and commercial buildings do we get a figure close to 40%. But plug loads are not affected by building design measures such as increased thermal insulation, or more efficient mechanical systems, or more attention to passive or sustainable energy strategies. It seems therefore a bit misleading to include them within “building” energy use, since it is not the “building” that is using such energy.
