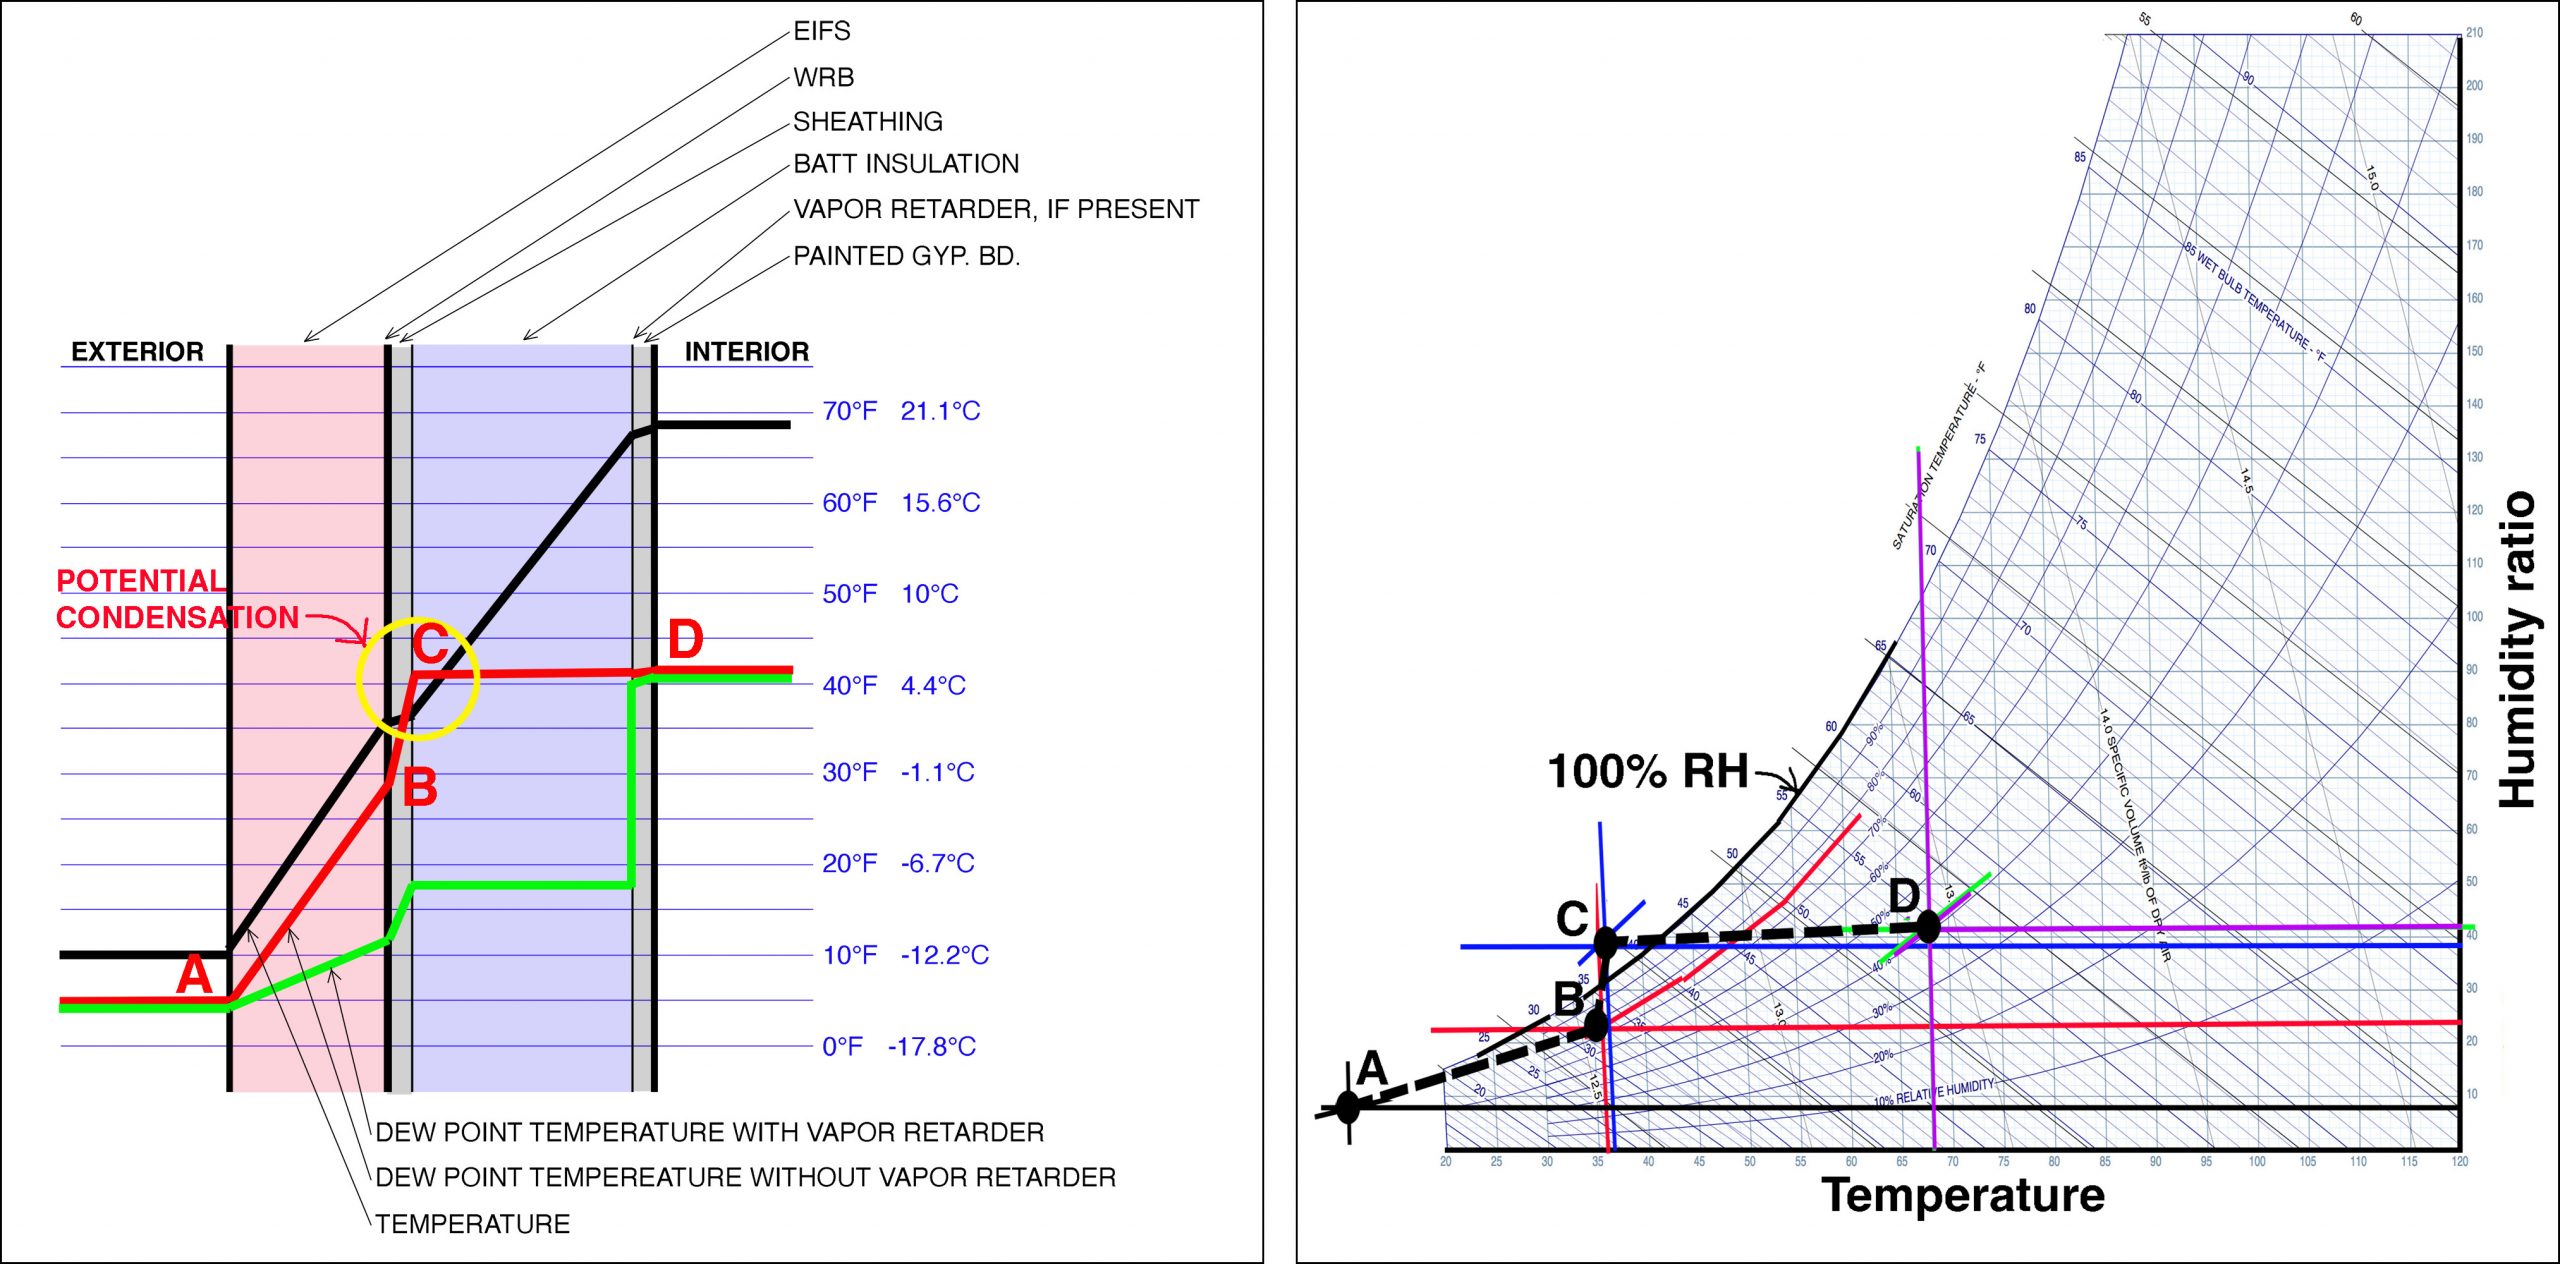
Schematic wall section (left) showing interstitial temperature and dew point temperature gradients. Condensation occurs where the temperature falls below the dew point temperature. In this example, taken from the default values in the calculator, the dew point temperature — shown as a red line — crosses over the temperature between the batt insulation and the plywood sheathing, indicating the potential for condensation at this location. When a vapor retarder is added between the gypsum board and batt insulation, the dew point temperature — shown as a green line — is always below the temperature, so condensation does not occur. The psychrometric chart (right) plots the combination of temperature and humidity ratio and shows where the relative humidity rises above 100% (i.e., where condensation occurs — at point “C” in both diagrams). Images by Jonathan Ochshorn.