Monthly Archives: May 2015

The continuing saga of Milstein Hall’s nonstructural failure

Cornell seems determined to create a series of building disasters on the entire north side of its historic arts quad. I’ve been discussing the problematic 100% schematic design proposal for a Fine Arts Library in Rand Hall recently. Also in the news lately is a lawsuit filed by Cornell against I.M. Pei’s new addition to the Johnson Museum. And Milstein Hall continues to self-destruct in both predictable and unexpected ways. The following videos describe a recent failure of the retaining wall and glass guard rail adjacent to Milstein Hall’s loading dock, as well as another leak in the green roof directly over the design studios.

The glass guard rail and retaining wall failure may have resulted from an inattention to the redesign of Milstein Hall when an underground parking structure was removed from the project as a result of the 2008 financial crisis. What was to be an ordinary reinforced concrete wall supporting the parking structure seems to have transformed into a retaining wall when the underground structure was canceled and replaced by soil, which exerts a lateral pressure, especially when saturated with water. Perhaps, thinking that someday the parking structure would be built, the wall was left in place, but without adequate attention paid to its new structural role. Water easily migrated through the construction joint between the building and the retaining wall, corroding reinforcement that for some reason connected the two structures. The detailing of the glass guard rail, as shown in this unedited construction video from August, 2011, also seems to help water get into the concrete wall by acting like a lever when subjected to horizontal loading, allowing small cracks to open up between the concrete wall and the metal channel which holds the glass in place.

The leak in Milstein Hall’s green roof is at least the third roof leaking incident since the building opened a few years ago. Students noticed water dripping on their desks in the vicinity of one of Milstein Hall’s many skylights; a large section of the green roof was subsequently removed so that the leak could be identified and repaired.

Buildings use 30%, not 40%, of total energy in the U.S.

[Updated and revised Oct. 1, 2016 to correct a minor math error in the calculations]

Much of the impetus for “green” buildings comes from an oft-repeated statistic about all the energy consumed in or by buildings: “In 2014, 41% of total U.S. energy consumption was consumed in residential and commercial buildings” [U.S. Energy Information Administration]. This statistic, which hovers around 40% plus or minus one or two percentage points, shows up in USGBC publications, U.S. government publications, and in hundreds of other sources.

Remarkably, it’s not easy to track down exactly what this alleged energy use consists of; that is, how exactly buildings are consuming so much of the total energy harvested or produced in the U.S. The problem is that the typical breakdown of energy usage doesn’t clearly identify the sources of energy and their applications — for example, energy use may be identified as “residential” or “commercial” but these values may not include electric power, which often has its own separate category. But we can’t easily find out where and how the electric power is used.

Figure 1. Primary energy consumption by source and sector, 2013 (US). Source: https://www.eia.gov/energy_in_brief/article/major_energy_sources_and_users.cfm

Figure 1. Primary energy consumption by source and sector, 2013 (US). Source: https://www.eia.gov/energy_in_brief/article/major_energy_sources_and_users.cfm

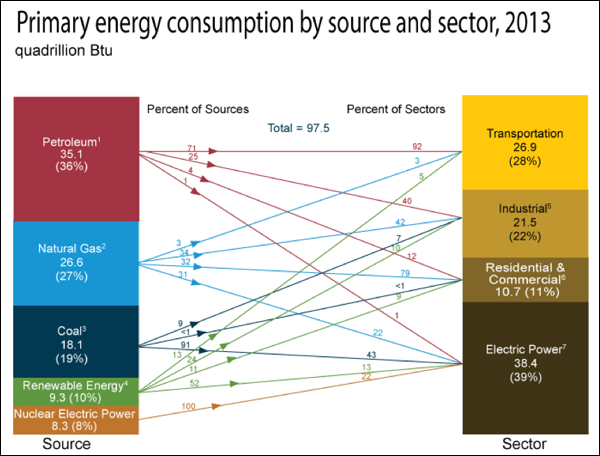
From Figure 1, we see that residential and commercial buildings in the U.S. use 11% of all energy, excluding electric power. Electric power generation uses 39% of all energy, but only some of that is used in residential and commercial buildings.

From Figure 2, we see that EU residential and commercial buildings use approximately 60% of total electricity produced, with residential accounting for about 30% and commercial buildings for the other 30% (it is presumed that the breakdown in similar for U.S. buildings). So that adds another 0.30 x 39% = 11.7% of all energy to residential and 0.30 x 39% = 11.7% to commercial, for a total residential and commercial energy use of 11 + 11.7 + 11.7 = 34.4%.

Figure 2. EU27 Electricity Consumption by Sector. Source: https://shrinkthatfootprint.com/how-do-we-use-electricity

Figure 2. EU27 Electricity Consumption by Sector. Source: https://shrinkthatfootprint.com/how-do-we-use-electricity

To make these statistics consistent with the oft-cited figure of 40%, we’ll assume that the combined residential and commercial electric usage in the U.S. is 74% of the total, rather than 60%, with 0.37 x 39% = 14.43% of all energy from residential, the same amount from commercial, and a total residential plus commercial energy use of 11 + 14.43 + 14.43 = 40%.

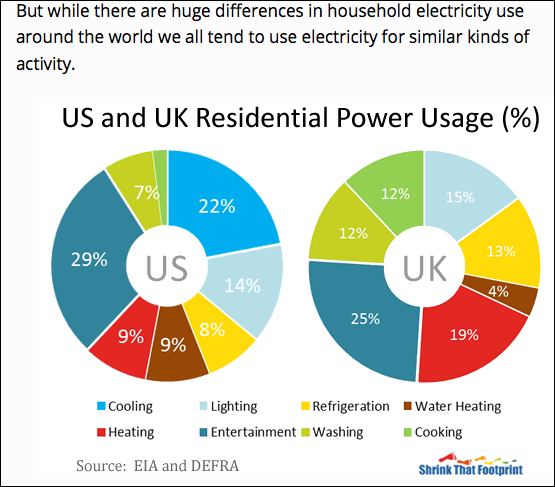
However, not all of this electric energy is used by “the buildings.” From Figure 3, we see that, in the U.S., 44% of this electric use is not really from the “building” itself: 29% of electric use is for entertainment (presumably television, computers, etc.), and another 15% is for things like refrigerators, washing, and cooking. That leaves 56% for the building; so instead of a residential electric usage of 14.43%, the actual “building” usage (cooling, lighting, etc) is more like 0.56 x 14.43 = 8.08% of all energy.

Figure 3. US and UK residential power usage. Source: https://shrinkthatfootprint.com/how-do-we-use-electricity

Figure 3. US and UK residential power usage. Source: https://shrinkthatfootprint.com/how-do-we-use-electricity

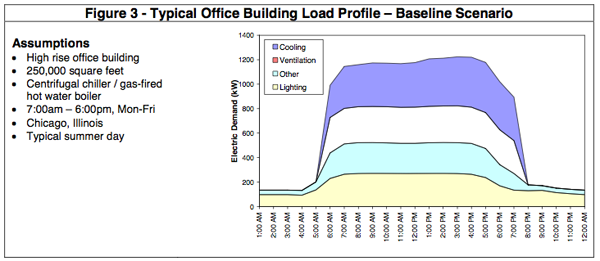
From Figure 4, we can see that commercial (office) buildings use about 20% of their electric usage for “other” things — presumably non-building plug loads — which leaves about 0.80 x 14.43 = 11.54% of all energy consumed in the U.S. for commercial building electric use.

Figure 4. Office building electric load profile. Source: https://www.iluvtrees.org/wp-content/uploads/2009/05/iltofficebuildingprofile.pdf

Figure 4. Office building electric load profile. Source: https://www.iluvtrees.org/wp-content/uploads/2009/05/iltofficebuildingprofile.pdf

Adding this all together, we can see that “buildings” (residential and commercial) consume 8.08 + 11.54 = 19.6% of all energy in the form of electricity and another 11% of energy other than electricity (mainly natural gas; see Figure 1). The total energy consumed by residential and commercial buildings is therefore about 30% of all energy consumed in the US, rather than the 40% figure so often cited.

Where does the other 70% go? Well, from Figure 1, we see that 28% goes to transportation (cars, trains, buses, planes, etc.) and 22% goes to industrial applications. The balance (about 20%) goes to various “non-building” uses of electricity (see Figure 2) of which about half, or 10%, is assumed to be for industrial/commercial non-plug-load uses and the remaining 10% is for other “non-building” uses (plug loads) within residential or commercial buildings.

In other words, only by adding the 10% plug load electric energy use to the 30% of total energy actually used by residential and commercial buildings do we get a figure close to 40%. But plug loads are not affected by building design measures such as increased thermal insulation, or more efficient mechanical systems, or more attention to passive or sustainable energy strategies. It seems therefore a bit misleading to include them within “building” energy use, since it is not the “building” that is using such energy.

More problems with Cornell’s Fine Arts Library proposal

Although the mezzanines proposed for the Fine Arts Library in Rand Hall at Cornell are noncompliant because too many floors are interconnected, it turns out that they would be noncompliant even if only two floors were interconnected. This is because they are too big.

Instead of measuring the actual areas of rooms and spaces, the architects of the Fine Arts Library 100% schematic design proposal have invented a new area category which they call “useful area.” This “useful area” omits what the architects call “circulation area” from the actual net areas of rooms and spaces, so these areas do indeed become quite useful: useful, that is, for fudging the actual numbers so that the mezzanines appear to be compliant.

For example, the net areas of Mezzanine 3.1 and Level 3 are 1,989 and 3,883 square feet respectively, according to data in the architect’s proposal. However, for a floor area of 3,883 square feet, the maximum allowable gross area of the mezzanine would be 3,883/2 = 1,942 square feet. Why use gross area instead of net or “useful” area? Because that’s what the Commentary to the IBC (which is the model Code from which the NYS Building Code is derived) says should be used. But even the net area of this mezzanine would be too big.

The second-floor mezzanine is just as bad. The architects claim that the “useful” area serving as the basis for the second-floor mezzanine area calculation is 7,610 square feet which, when the circulation area is added to it, creates a net area of 8,539 square feet. This number appears to include every room on the second floor, including the bathrooms. Clearly, the second-floor mezzanine is not “in” the bathroom space, and so this area must be excluded. Instead, let’s assume a more reasonable area of 8,000 square feet for the second floor. The maximum allowable mezzanine area would therefore be 4,000 square feet. However the net area listed for this mezzanine level is 4,589 square feet — far too big for the room or space it is in.

By hanging the stack levels above the second floor, two additional problems are created, or only one problem if you believe that creating a four-foot-high dust-collecting space under the entire second-floor stack level — just so the stacks will appear to be hanging from above — is not a problem. What remains a problem is that this geometry creates what the NYS Building Code or the ADA calls a “protruding object” — that is, a surface with a leading edge that is high enough above the floor (more than 27 inches) so that it presents a danger to anyone with a vision disability, even those using canes. The entire second-floor stack level, hovering about four feet above the rest of the second floor, creates one huge protruding object.

Not only does the entire edge of the second floor stack area appear to be a "protruding object," but the architects appear to have configured the edges with a knife-edge geometry

Not only does the entire leading edge of the second floor stack area appear to be a “protruding object,” but the architects appear to have configured these surfaces with a knife-edge geometry (photo screen-captured from a rendering linked from Ithacating in Cornell Heights)

More writings on the Fine Arts Library proposal.

Bound for Glory

I went to see three sets at Bound for Glory yesterday, WVBR’s long-running live (and free) Sunday evening radio concert program at Anabel Taylor Hall at Cornell. Guy Davis performed, and also took this selfie.

Me (left) and Guy (right) between sets at Anabel Taylor Hall

Me (left) and Guy (right) between sets at Anabel Taylor Hall at Cornell

The two of us were in the same class at New Rochelle High School, but our paths never really intersected there. Guy is an amazing singer, songwriter, musician, and performer — something I was not entirely aware of until I saw him play yesterday. You should definitely check out his web site and buy one or more of his CDs.

From the New Rochelle High School yearbook (1970)

From the New Rochelle High School yearbook (1970)

While we’re on this subject, it turns out that there were a number of other students from that same class from New Rochelle who went on to have professional careers as musicians. Amy Madden is a singer, songwriter, bassist, writer, and poet (recently inducted into the NYC Blues Hall of Fame). Andy Tuck “worked throughout the 70’s and 80’s as a professional jazz pianist and composer” (some of his amazing music can be heard here).

From the New Rochelle High School yearbook (1970)

From the New Rochelle High School yearbook (1970)

And then there were two other former friends who started out with me in the New Rochelle school system, but presumably finished their secondary education elsewhere:

Kapilow (left) and Mintzer (right) also turned into amazing musicians

Kapilow (left) and Mintzer (right) also turned into amazing musicians

I met Rob Kapilow in Junior High School where he impressed me, not necessarily with his piano playing, but with his impassioned interest and advocacy for entering into relationships with 15-year-old girls. But that was then. From his current web site, we read: “Kapilow’s range of activities is astonishingly broad, including his What Makes It Great?® presentations (now for over fifteen seasons in New York and Boston), his family compositions and Family Musik® events, his “Citypieces”, and residencies with institutions as diverse as the National Gallery of Canada and Stanford University.”

Bob Mintzer actually went to elementary school with me. I remember a “den” in his house — at that time, having grown up living only in apartments, I had been to very few actual single-family houses, and I’m pretty sure this was my first experience with a real den. Such things can make a big impression on a ten- or eleven-year-old boy. Bob is now “a twenty year member of the Grammy award winning Yellowjackets who also leads a Grammy winning Big Band, travels with his own Quartet, and plays with numerous bands globally.”

Am I leaving anyone out?